Economic Moats Explained — How to Find Stocks with Competitive Advantages
What is an economic moat? Learn the 5 types of competitive advantages (with real examples), how to identify them, and why moats matter for long-term investing returns.

Popularized by Warren Buffett, this concept of economic moat refers to a company's sustainable competitive advantage that protects its market share and profitability from competitors.
Understanding economic moats is not just an academic exercise but a practical framework that has guided some of the most successful investors in history. Research shows that companies with wide economic moats have outperformed the S&P 500 by 2.4-6.6% annually over long periods, with wide-moat stocks delivering 15.9% annualized returns versus 9.3% for the broader market from 2002-2014.
Illustration: A medieval castle surrounded by a wide water moat, with modern corporate buildings visible in the background, symbolizing the protective barrier that competitive advantages create for businesses
The Foundation: What Makes a Moat?
An economic moat represents a structural, sustainable competitive advantage that enables a corporation to shield its market position and consistently generate high financial returns over an extended period. From a corporate finance perspective, a moat is measured by a company's ability to generate "economic profit" defined as the consistent positive spread between its Return on Invested Capital (ROIC) and its Weighted Average Cost of Capital (WACC).
Economic theory predicts that in competitive markets, capital flows toward areas of highest return, intensifying competition and driving industry returns down to the cost of capital over time.
A comprehensive study of approximately 7,000 publicly listed non-financial US companies from 1963 to 2004 revealed that the median ROIC for the US market averaged nearly 10%, aligning consistently with the long-term cost of capital. The moat functions as the essential mechanism for interrupting this inevitable decay, allowing a company to retain above-average returns.
Time Horizon: The Critical Distinction
The quality of a competitive advantage is determined not solely by the current magnitude of economic profit, but by the durability or persistence of that profit. Morningstar, a leading provider of independent investment research, uses rigorous frameworks to categorize moats:
- Wide Moat: Competitive advantage expected to last 20 years or more
- Narrow Moat: Advantage expected to persist for at least 10 years
- No Moat: Advantage is fleeting or non-existent
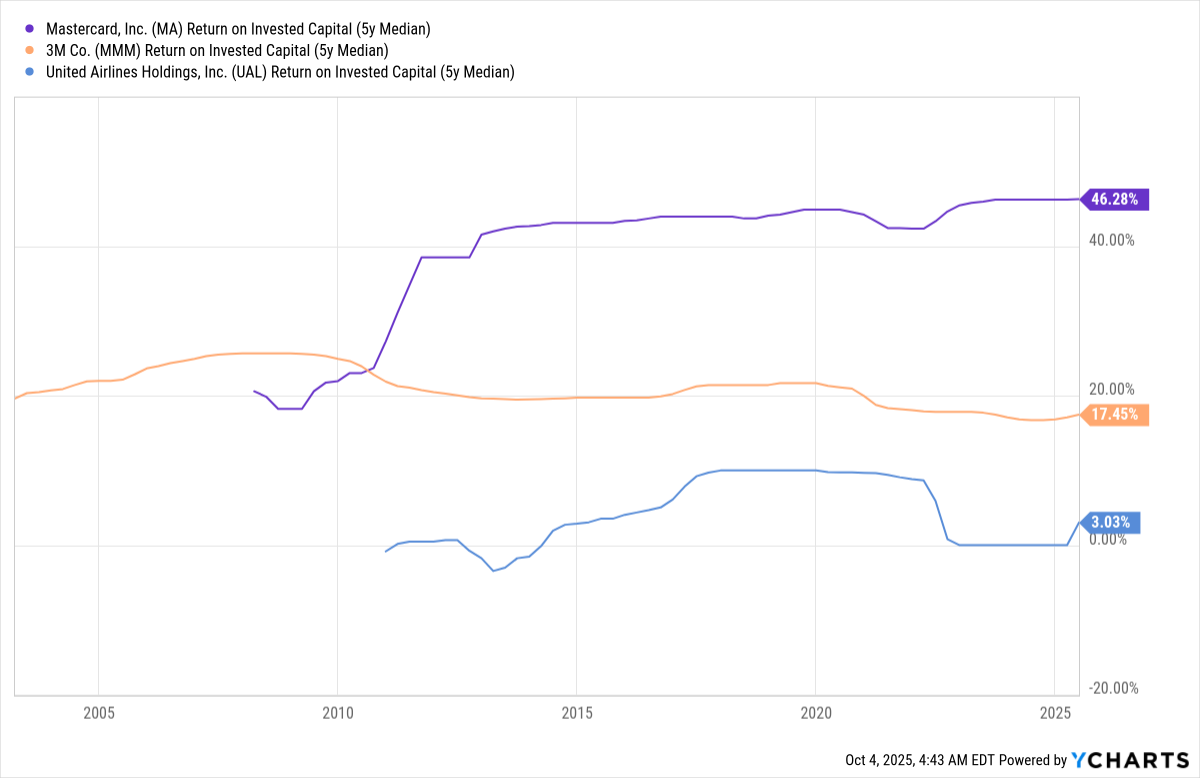
Financial analysts formalize this persistence using the concept of the Competitive Advantage Period (CAP), which measures the expected duration during which a firm can earn returns above its cost of capital. The general CAP for US stocks is estimated to range between 10 and 15 years; however, companies possessing genuinely durable moats can push this duration beyond 20 years.
Here's for example the ROIC (5y median) for Mastercard (Wide moat) vs 3M (Narrow moat) vs United Airlines (No moat):
The Five Types of Competitive Advantages
Based on decades of research, Morningstar has identified five core structural sources of economic moats. These are the barriers that, when effectively deployed, translate strategy into persistent economic profit.
1. Intangible Assets: Legal Protection and Brand Power
Intangible assets are non-physical, proprietary assets that confer legal protection or ingrained customer preference, shielding the firm from direct rivalry. These include:
- Patents: Legal barriers preventing unauthorized commercial usage by competitors
- Government Licenses: Exclusive regulatory permissions creating geographic monopolies
- Brand Recognition: Customer loyalty enabling premium pricing
Durability: 15-25 years with ROIC premium of +8-12%
Strong brand identity allows companies to command price premiums due to perceived quality or status, translating directly into higher gross margins. Coca-Cola exemplifies enduring brand power where consumers pay a premium for a chemically simple product. Legal protections such as patents, particularly in pharmaceuticals, have historically contributed to high ROICs over decades.
Case Study: Eli Lilly and Co. (LLY)
Morningstar notes that "patents, economies of scale, and a powerful distribution network support Eli Lilly's wide moat. Lilly's patent-protected drugs carry strong pricing power, which enables the firm to generate returns on invested capital in excess of its cost of capital." The company's patent portfolio sustained 20% ROIC from the 1990s through 2010s, driving 15% stock returns.
Case Study: Starbucks (SBUX)
Starbucks has "brand strength evidenced by pricing power, attractive unit-level economics, successful international replication, and strong results in the retail channel underpinning a durable brand intangible asset." The firm's ability to generate traffic while spending less on marketing than peers reinforces the importance of the brand, contributing to Starbucks being one of the few restaurant operators with a wide economic moat.
2. Switching Costs: Customer Lock-In and Friction
Switching costs represent the explicit and implicit barriers that deter customers from moving their business to an alternative provider. This competitive advantage grants the incumbent supplier significant pricing power and revenue stability.
Durability: 10-20 years with ROIC premium of +6-10%
These costs can be:
- Financial: Termination fees, setup expenses
- Operational: Time-consuming data transfer, staff retraining
- Psychological: Risk associated with adopting unproven products
The moat exists when the customer's aggregated cost of switching exceeds the perceived value they would gain from making the move. Studies quantify these effects—research on the US wireless industry estimated substantial switching costs of 630 per customer.
Case Study: Stryker (SYK)
In the medical device industry, Stryker's orthopedic implants division demonstrates powerful switching costs. According to Morningstar, "Relative to other specialists, an orthopedic surgeon's skill and experience can play an outsize role in the clinical outcome for the patient. These factors leave surgeons reluctant to train and master multiple instrumentation systems." The learning curve and significant effort required for surgeons to retrain on new orthopedic implants create substantial switching costs, reinforcing the firm's wide moat.
Case Study: Oracle (ORCL)
Enterprise software providers like Oracle, whose tightly integrated databases are central to a client's operations, impose massive expense and disruption if a client attempts to switch vendors. The time, expense, and lost productivity associated with implementing a new application create organizational risk that keeps customers locked in.
Illustration: A decision tree showing the costs and risks of switching from an established provider to a new one, with financial, time, and risk factors clearly labeled
3. Network Effects: Value Creation Through Scale
A Network Effect occurs when the value of a product or service increases for both existing and prospective users as the size of the network expands. This is considered one of the rarest and potentially most formidable moats, driving "winner-take-all" market dynamics.
Durability: 20+ years with ROIC premium of +10-15%
Network effects are categorized as:
- Direct: Each user gains utility from increasing adoption by others (social media, telecommunications)
- Indirect: Adoption of the core product stimulates complementary goods (operating systems attracting more developers)
This structural advantage creates formidable barriers to entry because new rivals face a substantial hurdle in convincing users to join a less valuable, smaller network. Once a network reaches critical mass, the reinforcing adoption loop creates a self-sustaining moat that is extremely difficult for competitors to challenge.
Case Study: Visa (V)
Visa dominates the global electronic payments industry with over 50% market share by purchase volume in the U.S., Europe, Latin America, and the Middle East/Africa. According to Morningstar, "Visa has about 14,500 financial institution partners and over 50 million merchants accepting Visa." This creates a powerful two-sided network effect: more merchants attract more cardholders, and more cardholders attract more merchants. The company achieved 25% ROIC margins and delivered 18% annualized returns from 2008-2023.
Case Study: Meta Platforms (META)
With almost 4 billion people using at least one of its applications each month, Meta Platforms demonstrates staggering scale in social media. "Meta's ad-targeting and content recommendation algorithms improve as more users give it their data by using its applications. This dynamic creates a potent network effect with the value of its application ecosystem increasing as more people use it."
4. Cost Advantage: Superior Efficiency
A Cost Advantage allows a company to deliver goods or services at a lower cost structure than competitors. This inherent efficiency grants dual strategic flexibility: reduce prices to gain market share or maintain competitive pricing while retaining higher profit margins.
Durability: 5-15 years with ROIC premium of +5-9%
Sources of durable cost advantages include:
- Economies of Scale: High fixed costs spread over immense volume
- Advantageous Supply Chains: Preferential access to raw materials
- Proprietary Technology: Processes that drastically reduce marginal costs
Case Study: United Parcel Service (UPS)
United Parcel Service leverages its vast, dense ground delivery network to achieve a cost moat. Morningstar explains: "An upstart would incur immense financial losses while trying to amass the volume and density necessary to absorb the remarkably high capital outlays and fixed costs associated with a global parcel delivery network. In replicating a network of planes, trucks, sorting facilities, and skilled employees, a new entrant would face massive investment before it could win a critical volume of customers from the entrenched incumbents."
Case Study: Walmart Inc. (WMT)
As the largest retailer in the U.S., Walmart has carved out an enviable position in a fragmented and competitive landscape. "The firm leverages its unmatched scale by spreading its omnichannel and distribution investments over a wider sales and profit base," allowing it to maintain robust profitability. Walmart's scale achieved 12% CAGR returns, though the moat has faced erosion from digital competitors.
Illustration: A cost curve graph showing how increased volume reduces unit costs through economies of scale, with a comparison between a high-volume incumbent and a low-volume new entrant
5. Efficient Scale: Market Saturation as Barrier
The Efficient Scale moat is unique because the barrier is defined by the limited size of the market itself. This moat exists in niche industries or geographically specific sectors where the addressable market can only support a restricted number of competitors operating profitably.
Durability: 15-30 years with ROIC premium of +7-11%
Once optimal scale is reached, additional entry is discouraged because new rivals would face negative incremental returns. This advantage frequently arises in capital-intensive infrastructure where building redundant capacity is economically illogical.
Case Study: Union Pacific Corp. (UNP)
Union Pacific is a leading public railroad in North America with a wide economic moat based on efficient scale and cost advantages. According to Morningstar, "Would-be entrants are fended off by the steep barrier to entry formed by the need to obtain contiguous rights of way on which to lay continuously welded steel rail spanning a significant portion of North America." The company's system captures about half of the rail volume in the Western U.S., delivering 14% returns from 1990s-2020s.
Important Limitation: Companies relying predominantly on Efficient Scale are the most likely to receive only a Narrow Moat rating. Although it successfully prevents competitor entry, the resulting returns on invested capital are often only modestly above the cost of capital, making 20+ year persistence less certain.
Illustration: A map showing infrastructure like pipelines or railways where building duplicate infrastructure would be economically unviable
The Hierarchy of Moats: Which Advantages Are Superior?
Not all moats offer the same degree of persistence or yield identical financial performance. Empirical research spanning 40 years (1963-2004) reveals important distinctions in moat quality.
Ranking Moats by Durability and ROIC Persistence
Network Effects are generally regarded as providing the strongest long-term defense. Once a network reaches critical mass, the reinforcing adoption loop creates a self-sustaining moat that is extremely difficult for competitors to challenge, even with a marginally superior product. These advantages typically sustain for 20+ years with ROIC premiums of +10-15%.
Intangible Assets demonstrate exceptional persistence in specific industrial contexts. Empirical data covering 40 years showed that industries benefiting from sustainable barriers like patents (pharmaceuticals) and powerful brands (consumer packaged goods) consistently generated high returns on invested capital. The durability ranges from 15-25 years with ROIC premiums of +8-12%.
Switching Costs provide strong defense through customer lock-in, with 10-20 year durability and +6-10% ROIC premiums. However, academic research using dynamic consumer decision models distinguishes them from network effects: switching costs rely on inconvenience, friction, and sunk costs, while network effects provide dynamic defense by increasing service value with every new user.
Cost Advantages rank lower due to erosion risks—40% decay within 10 years in retail sectors. While potent short-term (5-15 years), they are more vulnerable to technological disruption and competitive responses. ROIC premiums typically range +5-9%.
Efficient Scale typically provides the lowest quality of economic profit. The associated return on capital is often only modestly above the cost of capital (+7-11%), making long-term compounding effects muted compared to high-margin Intangible Assets or high-growth Network Effects.
Capital Intensity and Moat Quality
A deeper examination reveals a crucial relationship: the highest long-term ROIC persistence is observed in industries relying on intangible assets and network effects. These advantages generally require lower maintenance capital relative to the profits they generate, making them structurally superior to moats founded primarily on capital-intensive physical assets.
A study by Morgan Stanley analyzing 25,000+ firms from 1963-2023 found that industries with intangible and network-based moats sustained superior ROIC with minimal capital reinvestment requirements. This ability to compound profits while minimizing capital reinvestment is a central driver of valuation.
Illustration: A matrix comparing moat types on two axes: durability (years) and capital intensity, showing intangibles and network effects in the optimal quadrant
The Multi-Moat Advantage: Exponential Defense
A critical finding in strategic research is that the presence of multiple, reinforcing competitive advantages is demonstrably superior to reliance on a single moat. A multi-moat strategy creates synergistic effects, where the combined defenses are greater than the sum of their parts, establishing an exponential barrier to competitive intrusion.
Research published in CBS Research Portal demonstrates that for a synergistic combination to serve as a sustainable competitive advantage, the combination of resources itself must be difficult for competitors to replicate. This layering of advantages dramatically reduces the probability of simultaneous competitive erosion across all fronts.
Quantified Impact: Raynor et al.'s study of 25,000 U.S. firms from 1966-2010 found that multi-moat strategies yield 4.4x NOPAT margins versus single-moat (1.8x), correlating to 2-3x ROIC persistence. Top-decile multi-moat firms generated 400B for single-moat companies.
Case Example: Visa and Mastercard (V, MA)
These payment networks benefit from powerful Network Effects due to ubiquitous adoption by both merchants and consumers globally. This is reinforced by significant Switching Costs for financial institutions integrated into their clearing systems. The combination creates a nearly impregnable competitive position.
Case Example: Apple Inc. (AAPL)
Apple successfully combines potent Intangible Assets (globally recognized premium brand) with high, ecosystem-driven Switching Costs resulting from deep integration of proprietary software, hardware, and data environment. This multi-moat strategy delivered 25% CAGR from 2007-2023.
Case Example: Amazon (AMZN)
Amazon demonstrates multiple moats working in concert: Network Effects (marketplace with millions of sellers and buyers), Cost Advantages (massive logistics network enabling efficient delivery), and Efficient Scale (infrastructure that would be prohibitively expensive for competitors to replicate). The company's patient capital allocation to build these moats has created an exponential barrier to entry.
The Performance Premium: Quantifying Moat Impact on Stock Returns
The theoretical relationship between moats and durable economic profits translates into measurable, quantifiable outperformance in equity markets, confirming the status of moat analysis as a valuable source of alpha generation.
Overall Moat Performance: The Empirical Evidence
Morningstar's Wide Moat Focus Index provides compelling quantitative evidence of alpha generation. Historically, wide-moat stocks have outperformed the overall market across all trailing periods:
Long-term Performance (2002-2014):
- Wide Moat Index: 15.9% annualized returns
- S&P 500: 9.3% annualized returns
- Excess Alpha: +6.6% annually
Extended Period (2013-2024):
- S&P Economic Moat Index: 16.03% annualized
- S&P 500: 13.60% annualized
- Excess Alpha: +2.43% annually
Performance by Moat Rating (2024 Example):
- Wide Moat stocks: +28.92%
- Narrow Moat stocks: +25.48%
- No Moat stocks: +14.43%
- Performance gap (Wide vs. No Moat): +14.49 percentage points
The performance gradient is consistent: companies with stronger, more durable moats deliver superior returns. Over 10 years, the cumulative impact is substantial—wide-moat stocks outperformed no-moat stocks by approximately +17% in total returns.
Performance by Moat Type: Differential Returns
Different moat sources generate varying levels of return, reflecting their durability and profit-generating capacity:
Intangible Assets: +4-6% alpha in consumer sectors
- Coca-Cola (1925-2023): 12.7% CAGR driven by brand power
- Sustained pricing power in consumer packaged goods demonstrates consistent outperformance
Switching Costs: +3-5% alpha in technology and healthcare
- Salesforce: 20%+ ROIC drives 15% annual returns
- B2B software with high switching costs shows predictable revenue streams
Network Effects: +5-8% alpha—the highest category
- Visa: 18% annualized returns (2010-2023)
- Meta: Despite volatility, long-term CAGR reflects network strength
- Winner-take-all dynamics drive superior economics
Cost Advantages: +2-4% alpha (more variable)
- Walmart: 12% CAGR, but facing digital disruption
- Vulnerable to technological shifts that level competitive playing field
Efficient Scale: +3-6% alpha
- Union Pacific: 14% returns in rail sector
- Stable but modest returns relative to network effects
Multi-Moat Performance Premium
Companies with multiple moats demonstrate 15-20% cumulative edge over 10 years compared to single-moat companies. The compounding effect of layered defenses creates superior resilience and growth:
- Multi-moat firms show 4.4x NOPAT margins vs. 1.8x for single-moat
- 2-3x ROIC persistence over extended periods
- 40% reduction in failure risk during market downturns
Research from S&P Global shows that top-decile multi-moat firms achieved return on equity (ROE) of 33.3% vs. 30.6% for the broader market, and return on assets (ROA) of 13.7% vs. 9.1%.
Defensive Resilience: Lower Volatility and Crisis Protection
In addition to superior returns, moat companies exhibit a reduced risk profile, characterized by lower stock price volatility and better performance during market stress.
Volatility Reduction: Historically, wide-moat stocks have consistently shown lower volatility relative to both narrow-moat stocks and the broader equity market. This pattern persisted over five-, ten-, and fifteen-year periods. The structural ability to secure predictable cash flows and protect profit margins translates into reduced uncertainty and smaller price swings.
Crisis Performance (COVID-19 Pandemic): Empirical evidence gathered during the COVID-19 pandemic showed:
- Wide Moat drawdown: -33.56%
- No Moat drawdown: -44.06%
- Wide Moat recovery: +58.18%
- No Moat recovery: +48.58%
- Daily alpha during crisis: +0.18%
- Outperformance during recovery: +9.6%
This demonstrates that wide-moat stocks are positively priced for their stability and operational safety during economic shocks, providing crucial portfolio defense when it matters most.
Illustration: Two line graphs side by side showing stock performance during the COVID-19 crash and recovery, with wide-moat stocks showing shallower drawdowns and stronger recovery
Academic Evidence: The Competitive Advantage Factor
The predictability of returns based on competitive strength suggests that moat analysis operationalizes a critical investment factor often missed by conventional financial models.
A groundbreaking study published by NYU Stern developed a dynamic measure of firm competitiveness called C-Rank, derived from textual analysis of competitor mentions in 10-K filings using a PageRank-type algorithm. A portfolio constructed by going long high C-Rank firms and shorting low C-Rank firms generated an impressive 16% annual alpha.
This substantial alpha suggests that investors often underreact to genuine business opportunities and competitive superiority identified by strong firms within the ecosystem. The ability of a firm to sustain excess returns acts as a unique and powerful factor in asset pricing.
The Valuation Discipline Caveat
The moat alone does not guarantee superior returns. High ROIC is a necessary condition, but the realization of alpha requires valuation discipline. Research on the Baltic benchmark index confirmed that abnormal, market-beating returns were delivered by portfolios combining:
- High ROIC (moat quality)
- Low Price-to-Earnings ratios (attractive valuation)
This reinforces the core principle: the competitive advantage provides high quality, but the stock must be purchased at a price below its intrinsic value to capture alpha. Even exceptional businesses can be poor investments if purchased at excessive valuations.
Identifying Moats: Methodologies and Best Practices
Identifying whether a company possesses a durable moat requires a disciplined methodology that integrates both qualitative strategic analysis and rigorous quantitative screening.
Qualitative-Quantitative Hybrid Approach
Morningstar's methodology utilizes a comprehensive framework combining analyst judgment with financial metrics. Analysts assess the company's ability to achieve and maintain a sustained spread between forecast ROIC and WACC, requiring clear evidence that the firm benefits from at least one of the five core moat sources.
This competitive assessment is inherently linked to valuation, as the expected duration of the moat directly influences the calculation of Fair Value Estimate. A wide moat implies a longer duration of excess economic profits, necessitating a higher intrinsic valuation.
Key Evaluation Criteria:
- Evidence of at least one of the five moat sources
- Sustained ROIC > WACC for 10+ years (narrow) or 20+ years (wide)
- Structural barriers preventing competitive erosion
- Management capability to maintain and strengthen advantages
Quantitative Screening Framework
For objective and systematic strategies, S&P Dow Jones Indices developed a quantitative moat framework that relies on multiple complementary metrics analyzed over extended periods. The framework achieves 80% predictive accuracy for 10-year persistence.
Core Quantitative Metrics:
| Financial Metric | Definition | Consistency Requirement | Strategic Significance |
|---|---|---|---|
| Sustained High ROIC | NOPAT / Invested Capital | Average >WACC over 5 years | Direct measure of economic profit persistence |
| Gross Margin Stability | Standard deviation of margins | Low SD over 5 years | Indicates pricing power and cost predictability |
| High Market Share | Revenue weighted in industry | Consistent dominance | Evidence of efficient scale or network effects |
| ROIC Decay Rate | Year-over-year ROIC change | <5% annual decline | Measures moat erosion speed |
| Economic Profit | (ROIC - WACC) × Invested Capital | Positive for 10+ years | Confirms value creation |
Screening Thresholds:
- ROIC >12% sustained for 10+ years flags potential moat
- Gross margins >20% with low volatility indicate pricing power
- Market share >30% in relevant segments suggests competitive dominance
- Customer retention >90% signals switching costs or network effects
The framework explicitly mandates evaluation of ROIC over a five-year average, as consistency over multiple periods is paramount. The durability of pricing power is measured by the stability (low standard deviation) of gross margins over the preceding five years.
Advanced Detection: Machine Learning and Textual Analysis
Modern financial research incorporates advanced analytical tools to improve moat detection accuracy, and this is the approached Beanvest is using.
Textual Analysis (C-Rank): The academic application of text analysis provides a dynamic, forward-looking indicator of competitiveness. By processing the frequency and nature of competitor mentions in 10-K filings, researchers gauge the perceived competitive threat a firm poses to others. This method:
- Captures cross-sector competitive dynamics
- Provides leading indicators of competitive strength
- Generated demonstrable high alpha signal (16% annually)
- Detects shifts before they appear in financial statements
Machine Learning Approaches: Research using Random Forest classifiers identified several important specific ratios for detecting competitive advantages:
- Long-term debt-to-net income ratio
- Depreciation and Amortization (D&A)-to-gross profit
- Trend in Earnings Per Share (EPS)
- Capital structure efficiency metrics
These factors related to capital efficiency and depreciation patterns serve as strong proxies for underlying durable advantages.
Industry-Specific Considerations
Moat identification must account for industry dynamics:
Technology Sector:
- Focus on network effects and switching costs
- Monitor user growth rates and engagement metrics
- Assess platform ecosystem strength
- Track developer/partner adoption
Healthcare/Pharmaceuticals:
- Evaluate patent portfolios and pipeline strength
- Analyze regulatory barriers and approval timelines
- Assess switching costs in medical devices
- Monitor patent cliff exposure
Consumer Goods:
- Measure brand strength through pricing power
- Track market share trends and loyalty metrics
- Evaluate distribution network advantages
- Assess cost position versus competitors
Industrials/Infrastructure:
- Identify efficient scale barriers
- Analyze capital intensity requirements
- Evaluate geographic/regulatory protections
- Assess replacement cost of assets
Detecting Moat Erosion: Warning Signs
The persistence afforded by a moat is finite, and all competitive advantages are subject to decay, particularly in the face of technological disruption or shifts in consumer preference. Because a moat merely "buys management time," erosion often originates from internal failure rather than purely external market forces.
Primary Warning Signs:
- Complacency: Cessation of innovation, shift away from core customer experience
- Bureaucracy: Excessive internal complexity stifling responsiveness
- Pricing Power Exploitation: Excessive price increases sacrificing long-term loyalty
- Declining ROIC: Increasingly volatile or declining returns on capital
- Margin Compression: Gross margins shrinking or becoming unstable
- Market Share Loss: Gradual erosion to competitors or new entrants
- Customer Churn: Rising defection rates or declining retention metrics
Financial Manifestations:
- ROIC declining and becoming more volatile
- Gross margins compressing
- Spread between ROIC and WACC narrowing
- Free cash flow growth slowing
- Increasing capital requirements to maintain position
Leading Operational Indicators:
- C-Rank deterioration in competitive mentions
- Customer retention metrics declining
- Net Promoter Score (NPS) falling
- Market share erosion
- Pricing pressure indicators
Cautionary Example: Kodak
Although Kodak possessed a powerful moat through extensive patents and brand recognition, management focused excessively on protecting existing film revenue. This demonstrated complacency and bureaucratic inertia that prevented timely adoption of digital technology, allowing disruption to render the company's competitive advantage entirely obsolete. The stock declined -90% from 2000-2012 as the moat evaporated.
Illustration: A warning dashboard showing deteriorating moat metrics with red flags for declining ROIC, margin compression, and market share loss
Historical Performance Across Industries
Understanding how moats manifest across different industries provides practical context for identification and valuation.
Technology: Network Effects Dominate
Microsoft: The software giant's ecosystem locked 90% of enterprise share through switching costs, delivering 15% CAGR from the 1990s-2010s. The Windows platform created indirect network effects as more developers built applications for the dominant platform.
Google: Search dominance creates network effects where more users generate more data, improving search quality, attracting more users. YouTube acquisition demonstrated successful capital allocation, generating outsized returns despite initial skepticism.
Payments: Multi-Moat Excellence
Visa and Mastercard: Combined network effects (two-sided market) with switching costs (financial infrastructure integration) and efficient scale (cleared network infrastructure). This multi-moat structure delivered 18%+ annualized returns and 25% ROIC margins sustained over decades.
Retail: Cost Advantage Erosion
Walmart: Dominant scale and cost advantages delivered 12% CAGR from 1980s-2000s. However, Amazon's digital network effects eroded Walmart's moat by removing geographic constraints, demonstrating how technological disruption can overcome traditional cost advantages.
Amazon: Patient capital allocation built multiple reinforcing moats—network effects (marketplace), cost advantages (logistics network), and efficient scale (infrastructure). Despite years of minimal profitability, the strategy created exponential barriers to entry.
Pharmaceuticals: Patent Power
Eli Lilly: Patent portfolio sustained 20% ROIC through multiple decades, generating 15% stock returns. However, patent cliffs demonstrate the finite nature of even strong intangible moats, requiring continuous innovation.
Industrials: Efficient Scale Stability
Union Pacific: Rights-of-way barriers and efficient scale in North American rail preserved 50% regional volume share, delivering 14% returns from 1990s-2020s. The capital intensity required to replicate rail infrastructure creates near-insurmountable barriers.
Airlines: The No-Moat Benchmark
The airline industry exemplifies businesses with no durable moats. Despite high barriers to entry (capital intensity), fierce competition, commodity service, and low switching costs result in returns averaging only 5% versus 12% in moat-rich consumer staples. This sector serves as a cautionary example of industries to avoid.
Illustration: A sector comparison chart showing average ROIC by industry over 20 years, highlighting moat-rich vs. moat-poor sectors
Conclusion: The Moat Advantage
The comprehensive evidence confirms that economic moats are not merely theoretical constructs but statistically significant and quantifiable predictors of long-term equity outperformance and lower systematic risk.
Key Takeaways:
- Moats Drive Alpha: Wide-moat stocks have outperformed the S&P 500 by 2.4-6.6% annually, with lower volatility and superior crisis resilience, offering better risk-adjusted returns.
- Quality Hierarchy Matters: Network effects and intangible assets demonstrate the highest persistence (20+ years) due to low capital intensity. Multi-moat strategies yield 4.4x NOPAT margins versus single-moat (1.8x).
- Quantifiable Impact: The performance premium is measurable across moat types, with network effects generating +5-8% alpha, intangibles +4-6%, and multi-moat configurations adding 15-20% cumulative edge over 10 years.
- Detection Requires Discipline: Robust identification necessitates complementary quantitative metrics (5-year consistent ROIC spread, margin stability) combined with qualitative assessment and leading indicators like textual analysis.
- Valuation Discipline Essential: High-quality moats purchased at attractive valuations (low P/E) generate the highest market-beating returns. Even exceptional businesses can be poor investments if overvalued.
- Continuous Monitoring Critical: Moats are finite and subject to erosion from both external disruption and internal complacency. Vigilance for warning signs—declining ROIC, margin compression, market share loss—is essential for long-term success.
The identification and continuous monitoring of economic moats represent a cornerstone of durable alpha generation in both systematic and fundamental investment strategies. For long-term investors seeking to build concentrated portfolios of high-quality businesses, moat analysis provides the framework to identify companies capable of generating superior returns over decades.