Changelog
Advanced Filters
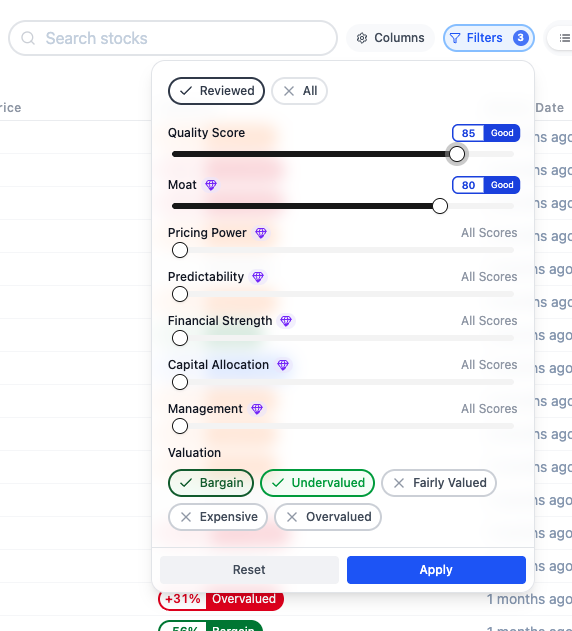
We've added powerful filtering capabilities to help you find exactly the stocks you're looking for. Filter by quality scores (Moat, Pricing Power, Predictability, Financial Strength, Capital Allocation, Management), valuation status (Bargain, Undervalued, Fairly Valued, Expensive, Overvalued), and review status.
Premium users can access advanced filters including individual score filters and valuation filters. All filters can be combined to create precise searches tailored to your investment strategy.
Score columns for premium users
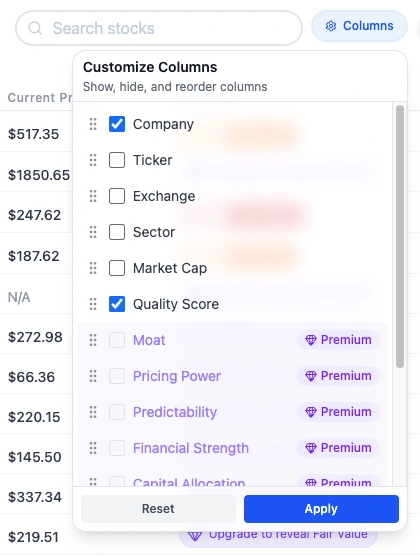
Premium users can now display and sort by individual quality score components on the Quality Stocks page. You can now see columns for Moat, Pricing Power, Predictability, Financial Strength, Capital Allocation, and Management scores.
Subsections navigation
Navigation to each subsection (moat, fair value, ...) of the company analysis report have been improved
Request companies research
Premium members can now request new companies to be researched and analyzed on Beanvest. Requested companies will be prioritized in our research pipeline, giving premium users more influence over which stocks are reviewed next. This helps ensure the analysis library grows based on what matters most to our community.
Display columns
You can now select the columns you want to display on the Quality Stocks list
Beanvest V2 is out
This new version of Beanvest V2 is now focused on helping you discover, analyze, and learn about the highest quality companies worldwide with in-depth qualitative and quantitative research, including our proprietary Quality Score system.
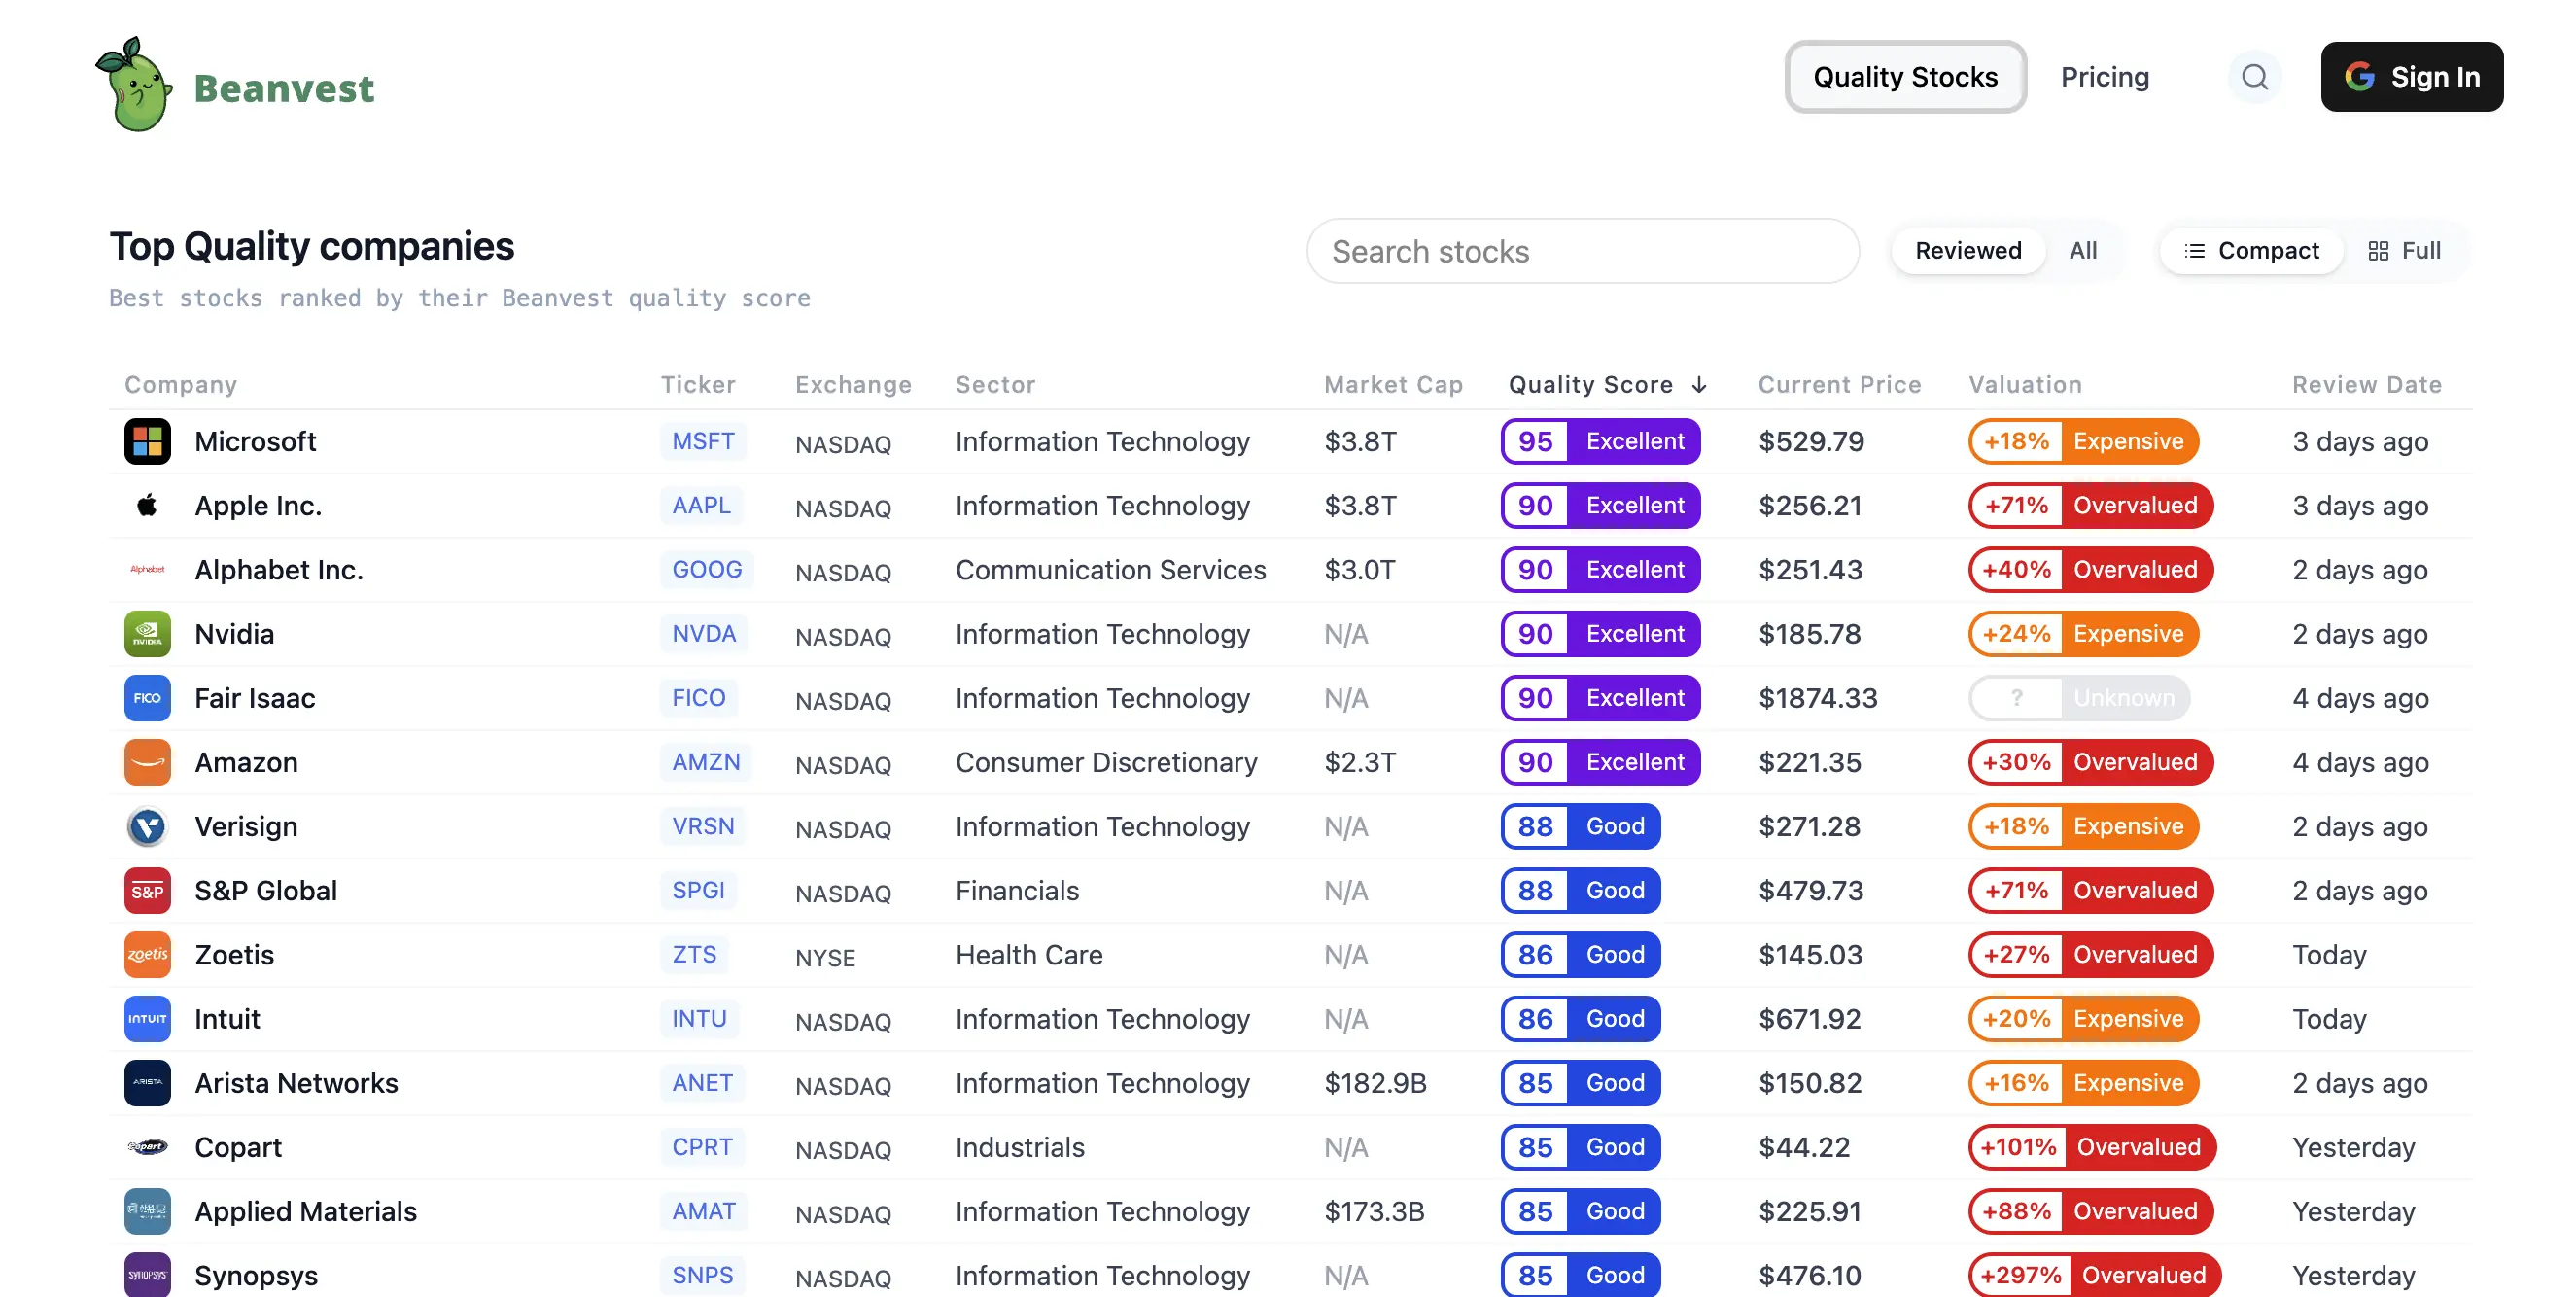
The new Beanvest makes it easy to compare companies, understand their competitive advantages, and identify those with strong fundamentals, durable moats, and world-class management. Our goal is to empower you to make smarter investment decisions by giving you access to premium data, advanced screening tools, and clear, educational insights—all in a minimalist, user-friendly interface.
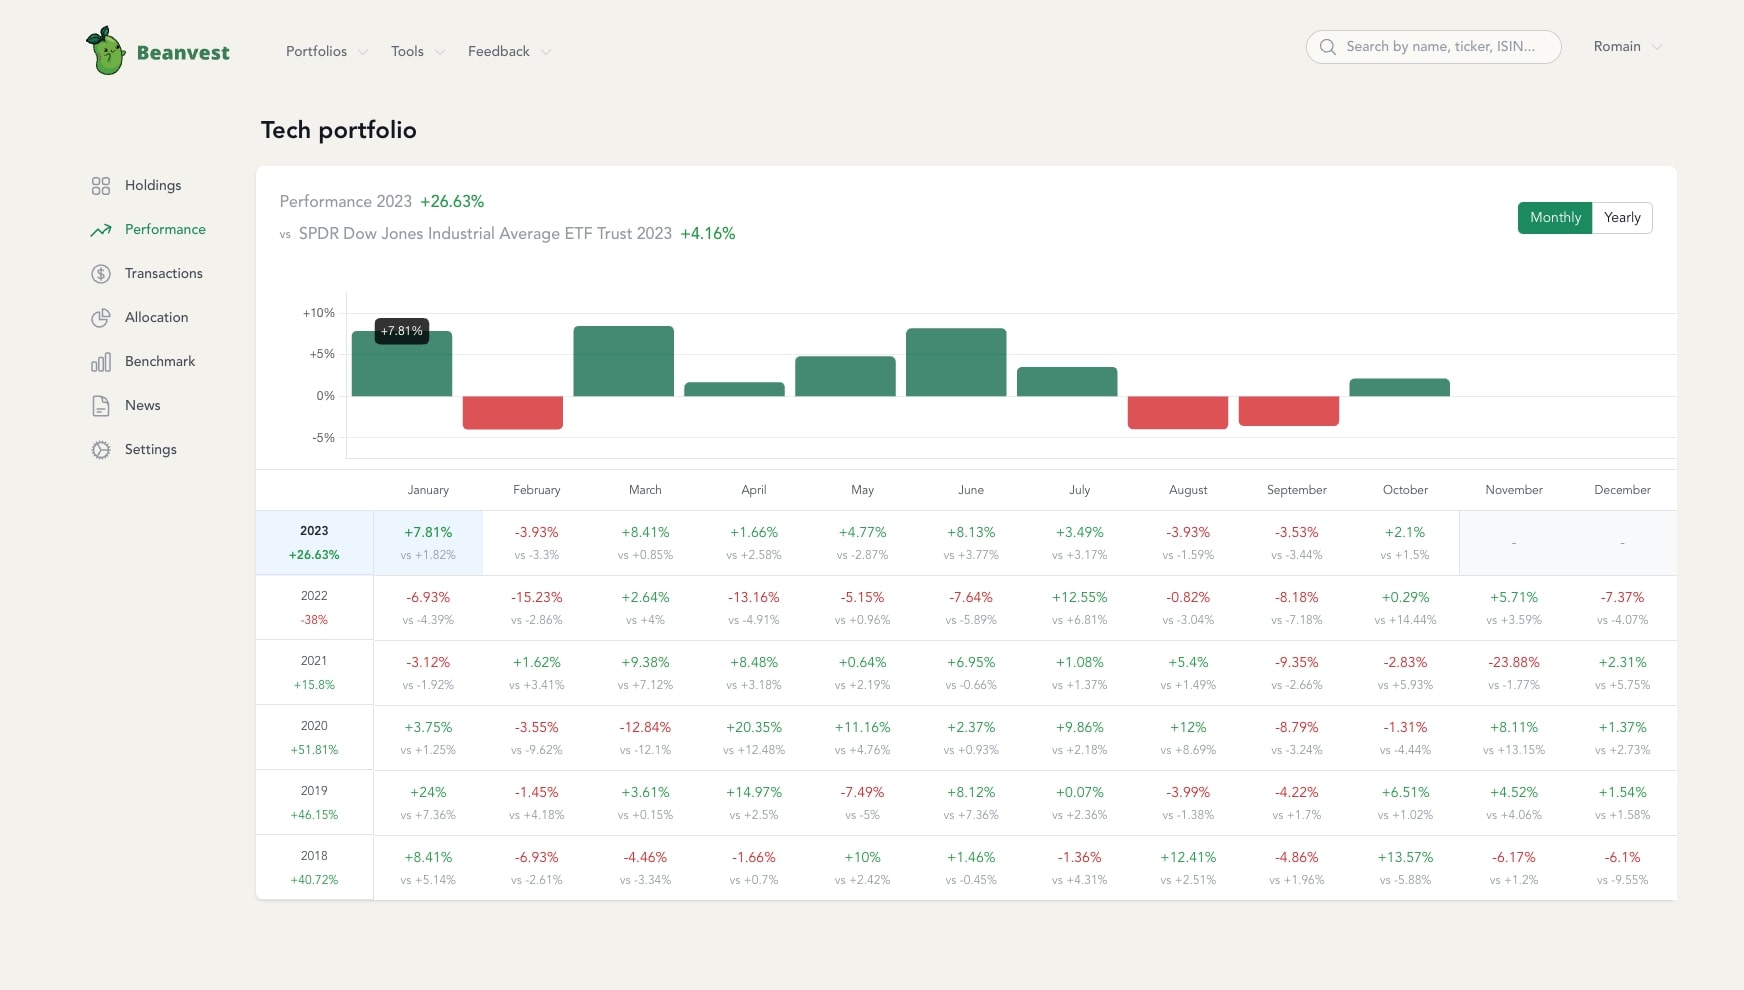
Beanvest Stock Portfolio Tracker
From 2020 Beanvest was mainly focused on being a stocks portfolio tracker by allowing you to conect multiple brokerage accounts, and measure your performance accurately.