Dividend Investing Key Metrics Every Investor Must Track
6 key metrics to track as a dividend investor to ensure your portfolio is creating the most benefit

Dividend investing has become increasingly popular among investors who want to create a steady stream of income. Investing in high-quality and well-paying dividend stocks allows investors to take advantage of the price appreciation as well as cash dividends.
Below are 6 of the most important metrics to track when investing in dividend stocks.
Dividend Yield
Dividend yield is the yearly return on your investment. It is calculated by taking the annual dividend divided by the stock’s current price.
For example, if a company pays a dividend of $1 and its current stock price is $20, the dividend yield is 5%. Generally, a higher dividend yield is considered more attractive, as it means that investors are receiving higher yields for less investment.
It’s important to note, though, that higher yields also indicate greater risk as they can reflect instability in a stock or an impending departure of a cash dividend.
Payout Ratio
The payout ratio is the percentage of earnings that are paid out to shareholders as dividends. It is calculated by taking the total amount of dividends paid divided by total earnings per share.
For example, if a company’s earnings per share are $5 and $2.50 is paid out in dividends, the payout ratio is 50%.
A high payout ratio indicates that a company is using a substantial portion of its income to pay out dividends, meaning that there is more of a chance that dividends may be cut in the future. On the other hand, low payout ratios indicate that a company is making most of its earnings in-house, rather than paying out to shareholders.
Dividend Growth
Dividend growth is a metric that indicates how quickly a company is raising dividends over time. It measures the percentage increase in dividends over a certain number of years. For example, if a company had raised dividends by 10% over the past three years, the dividend growth rate over that time would be 3.3%.
Investors generally look for companies that have a positive, consistently growing dividend. Companies that have a long history of dividend increase demonstrate that they are committed to returning value to shareholders and that they can be trusted with their cash dividends.
Dividend Streak
Dividend streak shows how many years a company has paid the same or higher dividend rate. It is a measure of how experienced the company is at providing dividends and how consistent they have been in increasing the dividend amount.
A long dividend streak is especially attractive as it indicates stability and suggests that the company has strong financials and management.
Companies that have the longest dividend streaks are known as Dividend Aristocrats (stocks with 25+ years of consecutive dividend increases) or Dividend Kings (stocks with 50+ years of dividend increases).
Free Cash Flow
Free cash flow is a fundamental measure of the cash a company generates after all its expenses. This metric is important when looking at dividend stocks because it shows how much cash a company has available to pay out to shareholders in the form of dividends.
Companies with strong free cash flow generally have more money to invest in dividends, making them more attractive options. While the payout ratio is also important for dividend stocks, taking both of these metrics into consideration gives a better overall picture of a company’s dividend health.
Debt to Equity Ratio
The debt to equity ratio shows the amount of debt compared to the amount of owners’ equity in the company. High debt levels generally indicate a company has taken on too much leverage, which increases the risk that the company may not be able to pay their dividend obligations.
A higher debt to equity ratio is usually unhealthy because it indicates that management may be risking too much and could eventually face cash flow shortages. That said, some are willing to take the extra risk in order to receive a greater return in the form of higher dividends.
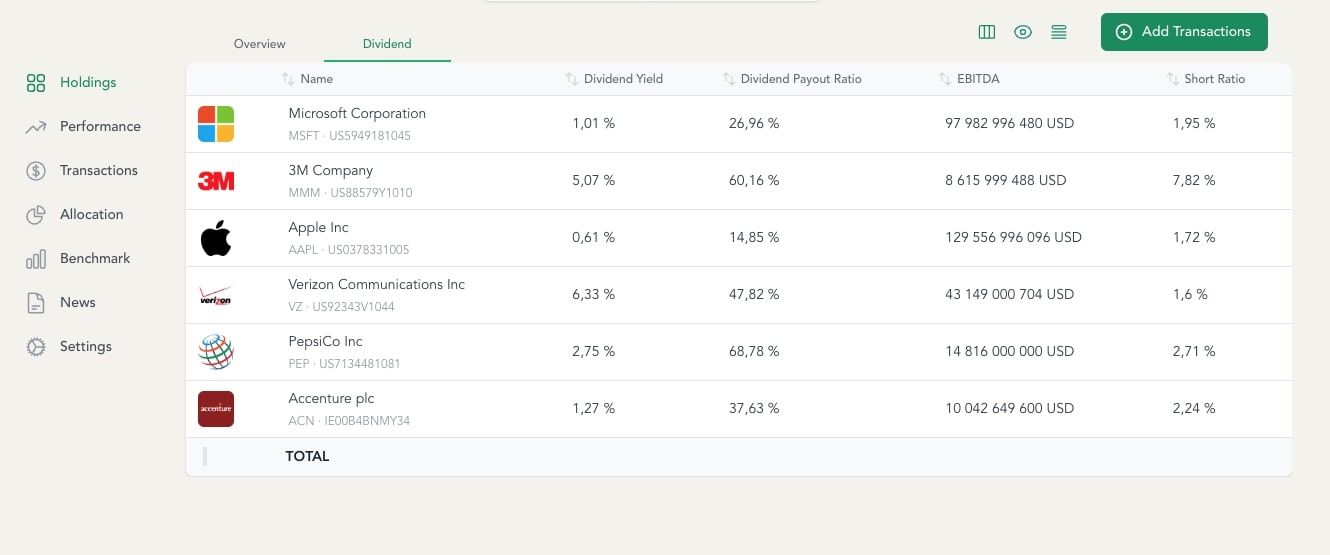
Monitor Your Dividend Portfolio Key Mertics
Beanvest is a poortfolio tracking software that is perfect for Dividend Investors. It provides an easy way to monitor all those key metrics for your dividend portfolio.


