Income Statement
What is an Income Statement?
An Income Statement (also called a Profit and Loss Statement or P&L) is a financial statement that shows how a company has performed financially over a specified period, typically a quarter or a fiscal year.
The Income Statement provides information about revenues (sales), expenses, and profits to investors and analysts. By studying the Income Statement, investors can assess whether a company earns a reasonable amount of money and determine what portion of that income comes from core operations versus investing activities or one-time items.
The Income Statement is one of the three core financial statements, alongside the Balance Sheet and the Cash Flow Statement. Together, these documents provide a complete view of a company's financial health and are essential for calculating financial ratios and estimating intrinsic value.
How to Read an Income Statement
Reading an Income Statement is straightforward when you follow it from top to bottom, as each line subtracts another layer of costs:
1. Revenue (Top Line): Start at the top with net sales or revenues. This represents the total amount of money received from the sale of goods and services during the period.
2. Cost of Goods Sold (COGS): Subtract the cost of goods sold, which includes raw materials, direct labor, and other costs directly associated with producing the goods or delivering the services.
3. Gross Profit: Revenue minus COGS equals Gross Profit. This represents the profit earned before operating expenses and is a key measure of production efficiency and pricing power.
4. Operating Expenses: These include Sales and Marketing, Research and Development, General and Administrative expenses, and other overhead costs. These expenses are necessary for running the business but are not directly tied to production.
5. Operating Income (EBIT): Gross Profit minus Operating Expenses equals Operating Income, also known as Earnings Before Interest and Tax (EBIT). This is the amount earned from core business operations and is closely related to EBITDA.
6. Interest and Taxes: After Operating Income, subtract interest expenses (the cost of debt financing) and income taxes.
7. Net Income (Bottom Line): The final line represents the total profit or loss for the period. This figure drives the PE ratio and other key valuation metrics.
Components of an Income Statement
The main components of an Income Statement are:
- Revenue: Gross sales and other revenues generated during the reporting period
- Cost of Goods Sold (COGS): The direct costs of producing goods sold or services rendered
- Gross Profit: Revenue minus COGS
- Operating Expenses: Selling, general and administrative expenses, depreciation, and research and development costs
- Operating Income (EBIT): Gross Profit minus Operating Expenses
- Interest Expense: The cost of servicing the company's debt
- Income Tax Expense: Taxes owed on the company's pre-tax income
- Net Income (Loss): The remaining profit or loss after all expenses are deducted
Key Metrics from the Income Statement
Several important financial ratios are derived directly from the Income Statement:
- Gross Margin: Gross Profit divided by Revenue. Measures production efficiency and pricing power.
- Operating Margin: Operating Income divided by Revenue. Shows what percentage of each revenue dollar is retained as operating profit.
- Net Profit Margin: Net Income divided by Revenue. Shows the overall profitability after all costs.
- EBITDA: Earnings Before Interest, Taxes, Depreciation, and Amortization. Adds back non-cash charges to operating income to measure operating cash generation.
- Earnings Per Share (EPS): Net Income divided by shares outstanding. The basis for the PE ratio.
These metrics are essential for comparing companies within the same industry and tracking a company's performance over time. They also feed into valuation models like enterprise value multiples and discounted cash flow analysis.
What Does the Income Statement Measure?
The Income Statement measures the profitability of a business over a specific period. It shows how much money the business has earned or lost and breaks this down into meaningful layers. Investors use the Income Statement to evaluate performance, compare companies, and make decisions about where to invest.
The key figure is Net Income, which represents the true "bottom line" of the business. However, experienced investors also pay close attention to operating income (to understand core business profitability) and free cash flow (to verify that accounting profits translate into actual cash).
Revenue trends are equally important. A company with growing revenues demonstrates market demand for its products or services, while declining revenues may signal competitive pressure or a shrinking market.
Income Statement vs Balance Sheet
While the Income Statement shows how a company performed over a period, the Balance Sheet shows the company's financial position at a specific moment in time. The Income Statement tracks flows (revenue and expenses), while the Balance Sheet tracks stocks (assets, liabilities, and equity).
The two statements are connected: net income from the Income Statement flows into retained earnings on the Balance Sheet. Together with the Cash Flow Statement, they provide a complete picture of a company's financial health.
Income Statement vs Cash Flow Statement
The Income Statement and the Cash Flow Statement can tell different stories about a company's performance. The Income Statement includes non-cash items like depreciation and stock-based compensation, which affect reported profits but do not involve actual cash movements.
The Cash Flow Statement shows the real cash generated and spent during the period. A company can report strong net income on its Income Statement while having weak cash generation if it has large non-cash revenues or growing receivables.
For this reason, investors often calculate free cash flow from the Cash Flow Statement to verify that a company's reported earnings are backed by actual cash, rather than relying solely on the Income Statement.
Example: Reading a Real Income Statement
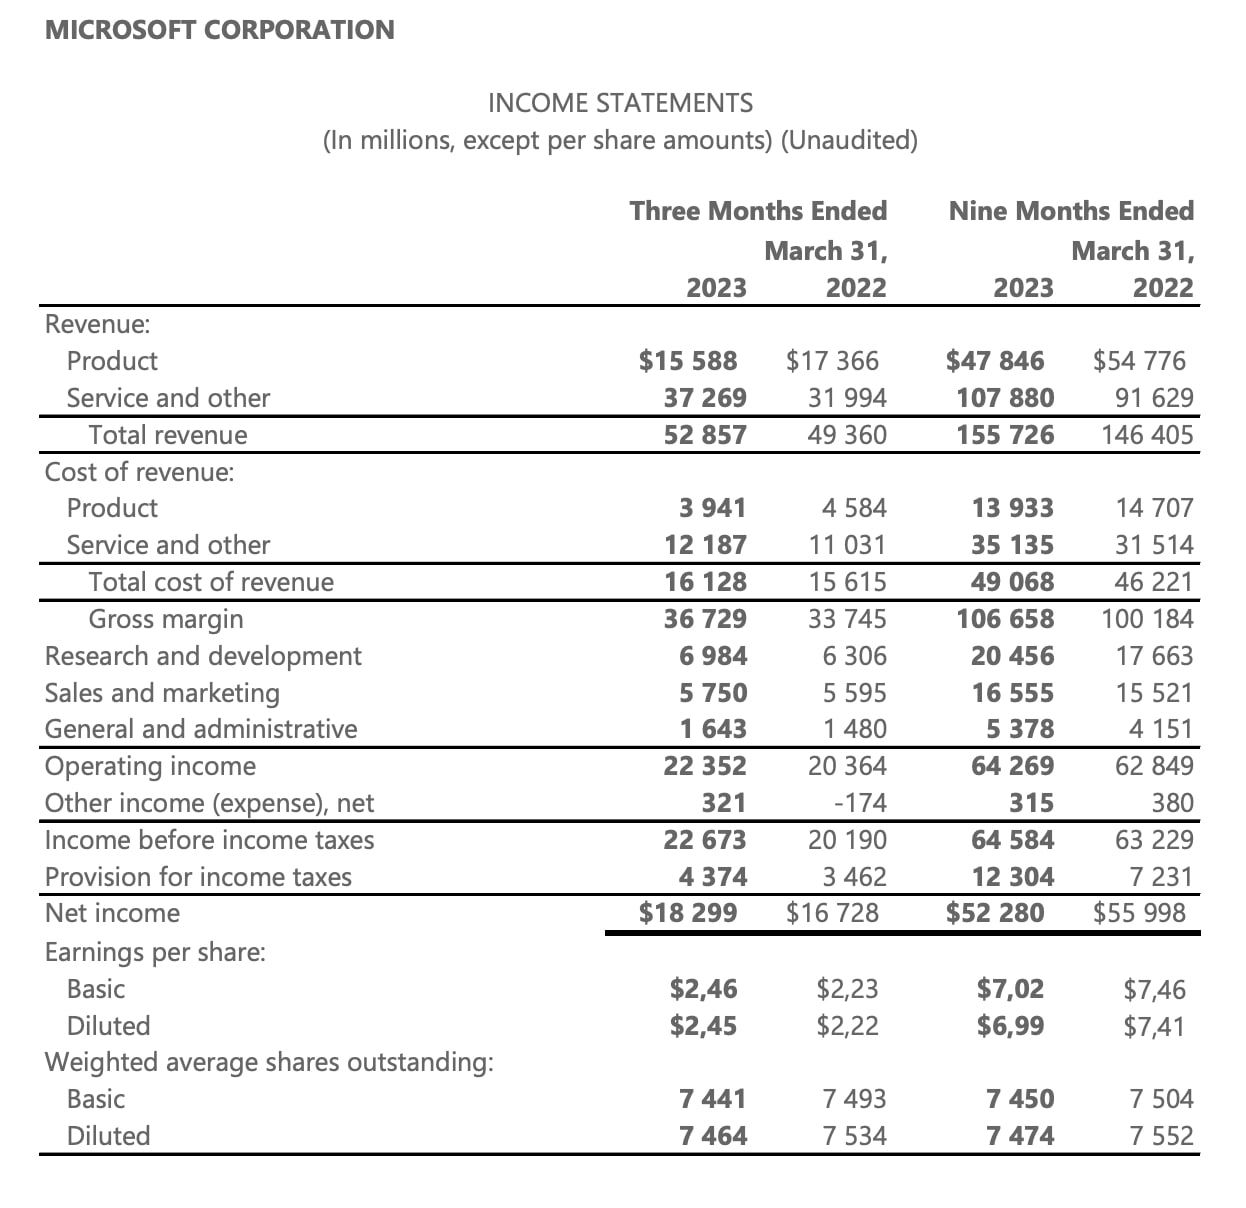
For a practical example, consider Microsoft's Income Statement. The company reports:
- Revenue: Total revenue from products and services
- Cost of Revenue: Direct costs of delivering those products and services
- Gross Profit: Revenue minus cost of revenue
- Operating Expenses: Research and development, sales and marketing, general and administrative
- Operating Income: Gross profit minus operating expenses
- Other Income: Interest income, investment gains
- Income Before Taxes: Operating income plus other income
- Net Income: Final profit after taxes
By following this structure from top to bottom, investors can identify where a company makes money, where it spends money, and how much profit remains at the end.
Frequently Asked Questions
What is the difference between an income statement and a balance sheet?
What is the most important line on an income statement?
What is the difference between gross profit and net income?
How often do companies report income statements?
Founder of Beanvest. Self-directed investor since 2015, building tools to help individual investors make better decisions.